Infrastructure that talks: from a mechanic's ear to MCP
Cars used to be diagnosed by ear. Then OBD-II and the CAN bus arrived and mechanics stopped being tribal. Software is going through the same shift right now: OpenTelemetry standardizes how infra reports what's happening, and MCP standardizes how an agent can ask it.
There was a time when diagnosing a car was an art. A good mechanic would pop the hood, listen to the engine running, and tell you from the sound alone whether the belt was loose, a valve was knocking, or the mixture was running lean. They'd run a hand along the hoses feeling for odd vibrations, look at the color of the exhaust smoke, smell the oil, feel the clutch. Diagnosis lived in the mechanic's head: experience distilled into intuition.
Then came OBD-II and the CAN bus, and the car stopped being a black box. The ECU no longer waited to be auscultated: now it talked. With a well-defined protocol, any tool — from a shop scanner to a phone app — could ask the car for its state and get a structured answer: error codes, RPM, lambda, coolant temp, rail pressure. Knowledge stopped being tribal and became an API.
In software, the same thing happened — and is still happening.
The SRE mechanic
For years, diagnosing production looked a lot like a 1980s repair shop. Someone with experience would open a session, eyeball top, tail -f a log, run kubectl describe, and mentally compare it against how the system "looked" when it was healthy. If you were lucky there were a couple of Grafana panels. If not, there was Slack and memory.
It was expert work, but it was also fragile: knowledge piled up in individual heads, and diagnosing a new incident depended on the right person being awake at the right time.
OpenTelemetry: the OBD-II of software
OpenTelemetry did for applications what OBD-II did for cars: a common protocol so any system can expose its internal state — metrics, logs, traces — in a way any tool can read. It no longer matters whether the app is in Go, Python, or Rust; they all speak the same telemetry language.
But exposing data is not the same as understanding it. The OBD-II scanner spits a P0420 at you and you have to know that means "catalyst efficiency below threshold." A higher level is needed: a layer that can interpret that data in context.
MCP: the interface for the copilot
That's where MCP (Model Context Protocol) comes in. MCP is the other end of the chain: a standardized way for a language model — an agent — to talk to any system and ask it for information or trigger actions. If OpenTelemetry makes the app talk, MCP makes the agent able to listen and ask back.
Together they close the loop:
- infra exposes its state in a structured way (OTel),
- the agent walks through it the way a mechanic walks through scanner codes (MCP).
My case: giving my agents access to the infra
A few months ago I made a simple decision that changed my workflow: stop being the middleman between my dev agents and my infrastructure. If the agent has to understand why a deploy is failing, let it read the deploy. If it needs to know what's happening with a pod, let it look at the log directly.
My stack is pretty standard for self-managed bare-metal infra:
- k3s as orchestrator
- Portainer to manage stacks and containers
- Grafana + Loki + Tempo for metrics, logs, and traces
- ArgoCD for GitOps
- GitHub Actions for CI
- Terraform and Ansible for provisioning
On top of that I run five MCPs inside the infra itself:
| MCP | What it exposes |
|---|---|
kubernetes-mcp | cluster context, pods, events, configmaps, live logs |
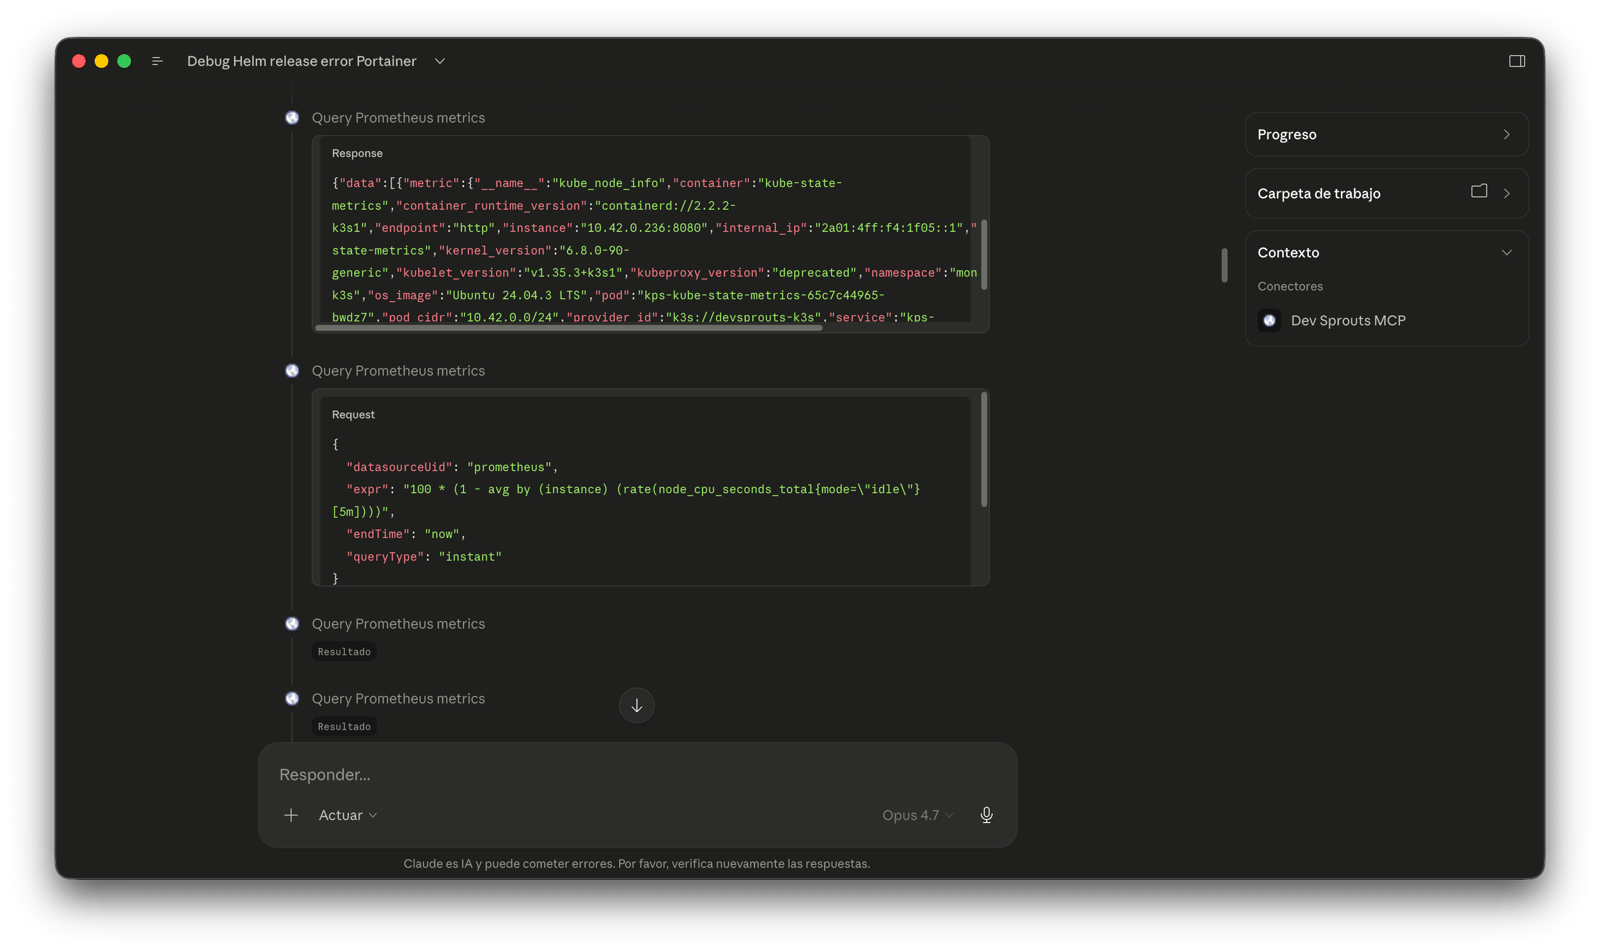
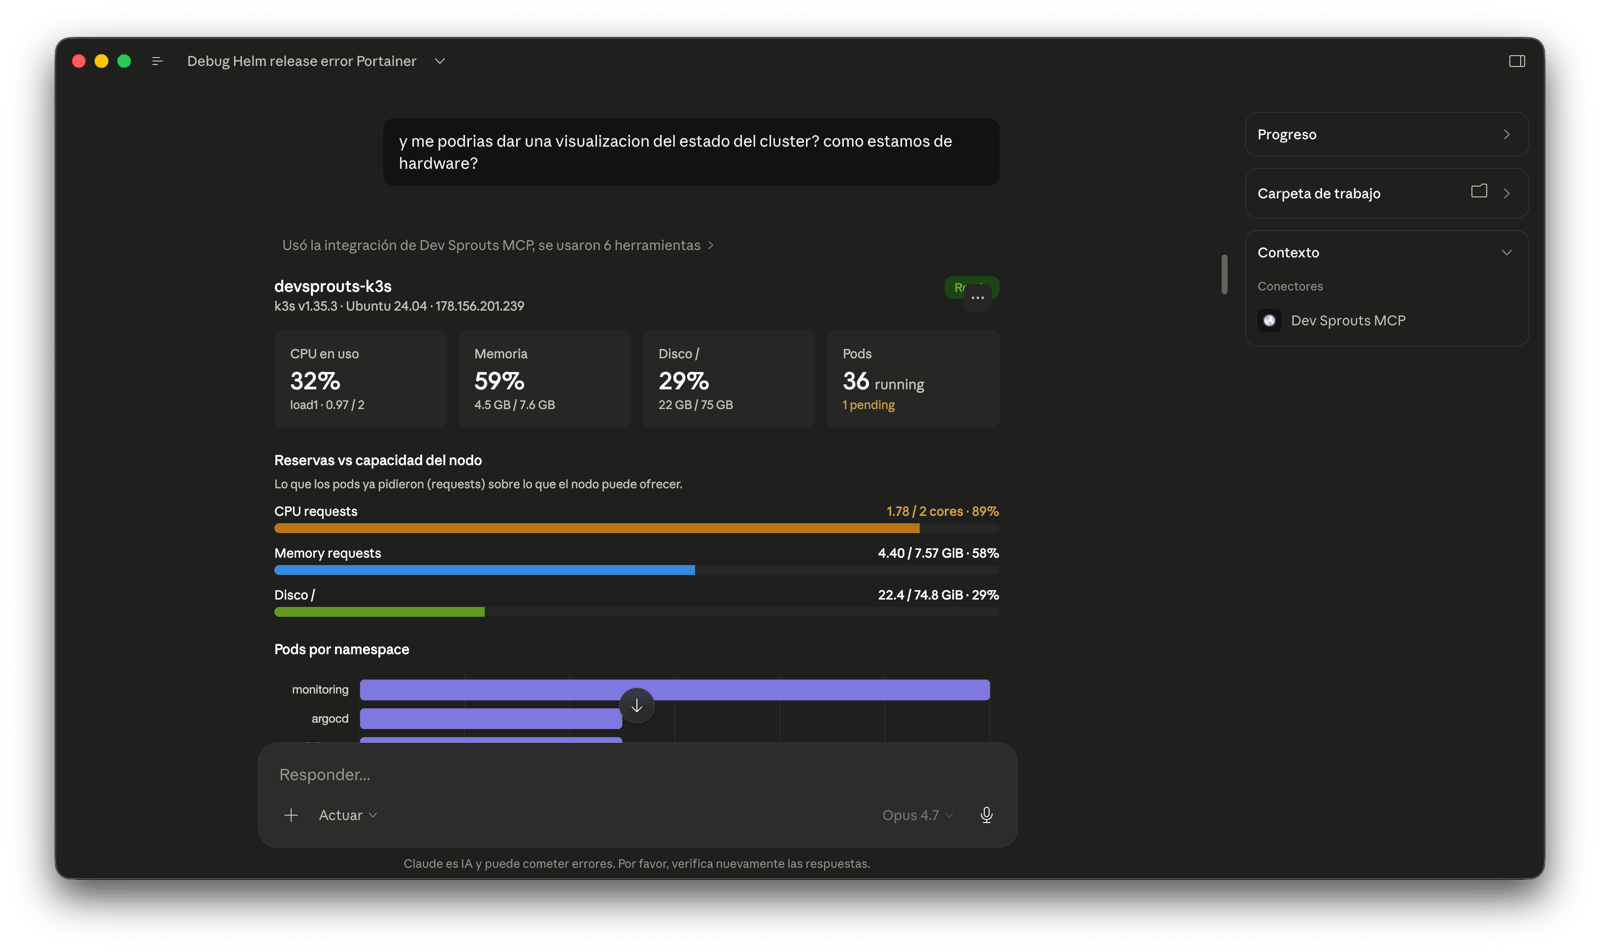
grafana-mcp | Prometheus queries, Loki searches, panels, alerts |
argo-mcp | application state, syncs, drift, history |
portainer-mcp | stacks, containers, networks, volumes |
github-mcp | repos, PRs, GitHub Actions runs and step logs down to the line |
With that, when a workflow fails the agent can request the run, read the steps, trace the error, and cross-reference it with what's happening in the cluster in the same time window — without tab-hopping.
The portal: how I expose it without leaving the door open
Infrastructure that talks to anyone isn't infrastructure, it's an incident waiting to happen. So everything sits behind a Cloudflare MCP Server Portal, with Google OAuth as the front door. Agents — mine, not anyone's — authenticate with my account, the portal validates the token, and only then do the internal MCPs become visible. The servers are never exposed to the public internet: the portal is the only surface that talks to the world.
It's the same idea as the OBD-II port in a car: the port is there, but you have to physically plug in to use it. In my case, the "physical key" is Google OAuth.
What changes when infra talks
The practical change is hard to overstate. Before, an agent writing code against an API had to guess why a deploy was failing: I'd paste the log, it would interpret it, suggest a fix, I'd apply it, watch if it worked, report the result. A game of telephone between human and machine.
Now the flow is direct:
- the agent opens the trace in Tempo and sees where the request breaks,
- cross-references the Loki log for the same time window,
- checks the pod events in Kubernetes,
- checks whether the latest ArgoCD sync left anything drifted,
- and assembles the diagnosis without me being a proxy.
I go from being the middleman to being the one who decides what to do with the conclusion. It's the same transition the auto repair shop went through thirty years ago: the trade doesn't disappear, but the expert stops spending time collecting symptoms and starts spending it interpreting them.
What's next
OpenTelemetry and MCP aren't finished ideas yet. The MCP catalog grows every week, the protocols keep getting tweaked, and the practice of giving an agent "the right context, no more no less" is still an open problem. There are fine-grained decisions I'm still tuning: which permissions to give each MCP, how much retention to expose, when to let the agent act and when to keep it read-only.
But the direction is clear: infrastructure that doesn't talk, that lives sealed in itself and depends on a human to translate, is becoming as obsolete as a '78 Falcon. It works, but no one wants to fix it by ear anymore.